How to See Net Graph in CS2
Whether you’re grinding ranked Premier matches or warming up in aim servers, knowing your performance stats can make or break your gameplay. The net graph has always been a Counter-Strike player’s go-to tool for tracking FPS, ping, packet loss, and other metrics that directly affect match performance. But with the move from CS:GO to CS2 and the Source 2 engine, things have changed - accessing performance stats in Counter Strike 2 is different, and the old net_graph console command doesn’t work anymore. Many players are left wondering how to get those valuable stats back on their screen or how to access the Net Graph feature in CS2.
We’ll cover every working method to see performance and network information in CS2, including how to use a console command to access key data. You’ll learn how to use the built-in Telemetry HUD, which console commands still work, how to read the data, and how to fix it if it’s not showing up. By the end, you’ll have the tools to monitor your game’s health like a pro and understand how even a small change in network metrics can impact your gameplay.
Why the Net Graph Matters in CS2
The net graph isn’t just a nerdy stat tracker - it’s a vital diagnostic tool. Monitoring system performance metrics like FPS and latency is important for ensuring optimal gameplay and troubleshooting issues in Counter-Strike 2. If you’ve ever felt like your bullets “aren’t hitting” or that your crosshair is lagging behind your movements, your performance metrics can often reveal the reason.
What the Net Graph Shows (Ping, FPS, Packet Loss)
Traditionally, the net graph includes:
- Ping: the time it takes for your PC to communicate with the game server, measured in milliseconds (ms). Lower is better; ideally under 50ms for competitive play.
- FPS (Frames Per Second): how many frames your PC renders per second. Higher FPS means smoother gameplay; competitive players often aim for 144 FPS or higher.
- Packet Loss: the percentage of data lost during transmission between you and the server. Even 1–2% packet loss can cause noticeable issues, like missed shots or player teleportation.
- Choke: when your client can’t send data fast enough to the server. This usually appears under high network load or when the server is overloaded.
By using the net graph to track these metrics in real time, you can pinpoint whether issues are caused by hardware performance (low FPS) or network instability (high ping or packet loss).
How Performance Data Impacts Gameplay
Performance numbers aren’t just for show - they have a direct impact on competitive results:
- Low FPS: Makes aiming harder because animations and mouse input feel less responsive.
- High Ping: Causes delayed hit registration; you might feel like you shot first, but the server disagrees.
- Packet Loss: Creates stutters, rubber-banding, or sudden player movements, breaking your aim tracking.
- Frame Time Spikes: Even with high FPS, sudden frame delays can cause micro-stutter.
Monitoring these metrics while playing is crucial, as it allows you to identify and address issues in real time to maintain optimal performance.
Knowing which of these is happening helps you apply the right fix - whether it’s lowering graphics settings, switching to a wired internet connection, or contacting your ISP.
Net Graph in CS:GO vs CS2 - Key Differences
In CS:GO, you could simply open the console and type: net_graph 1. However, this command doesn’t work anymore in CS2.
This would show a detailed performance graph at the bottom of your screen, with customizable placement and scaling. The net graph was a feature in CS:GO that allowed players to monitor real-time performance and network data directly in-game.
In CS2, Valve removed this functionality. The Source 2 engine focuses on a cleaner interface with fewer console dependencies for common features. Instead of net_graph, you now have:
- The new Telemetry HUD option in the settings menu.
- New console commands for FPS and network stats.
- Third-party overlays from Steam, NVIDIA, and AMD.
Is the Net Graph Still in CS2?
Technically, no - at least not in the same form as CS:GO. But there are built-in replacements that serve the same purpose. In CS2, performance metrics are now shown on the screen using updated commands and settings.
Why the Classic net_graph Command Doesn’t Work
Type net_graph 1 in CS2’s console, and you’ll see an “Unknown command” error. This isn’t a bug - Valve intentionally removed it. Previously, players would start the net graph by entering the net_graph 1 command in the console to display performance metrics. The Source 2 engine uses a different architecture for performance monitoring, and the net graph as we knew it was never implemented in CS2.
What Valve Changed with the Source 2 Engine
With Source 2, Valve:
- Integrated performance monitoring directly into the Game Settings menu.
- Standardized the display location for performance stats.
- Reduced clutter by removing the bottom-screen graph and focusing on minimal overlays.
- Updated rendering to make frame time a more relevant performance metric than FPS alone.
These changes mean you no longer have to remember specific commands just to check basic performance data - but it also limits customization.
New Tools That Replace the Old Net Graph
The closest equivalents to net_graph in CS2 are enabled using the following command options:
- Telemetry HUD: Found in settings; shows FPS, frame time, ping, packet loss.
- cl_showfps command: Simple FPS counter, adjustable detail level.
- cq_netgraph 1: Brings back a simplified network graph in the top right corner (match-only).
- cq_netgraph_problem_show_auto 1: Lightweight network status HUD.
These can be used individually or in combination to mimic the old net graph functionality.
Method 1 - Using the CS2 Telemetry System (Recommended)
Valve’s recommended way to monitor your performance in CS2 is the built-in Telemetry system. It’s easy to enable and works without touching the console. To use the Telemetry system, simply follow a series of steps to enable and access its features.
Step 1 - Enable the Developer Console (Optional)
While you don’t need the console to use telemetry, it’s a good idea to have it enabled for quick testing:
- Open Settings.
- Go to Game.
- Set Enable Developer Console to Yes.
- Press the default key (~) to open it. After typing a command in the console, press enter to execute it.
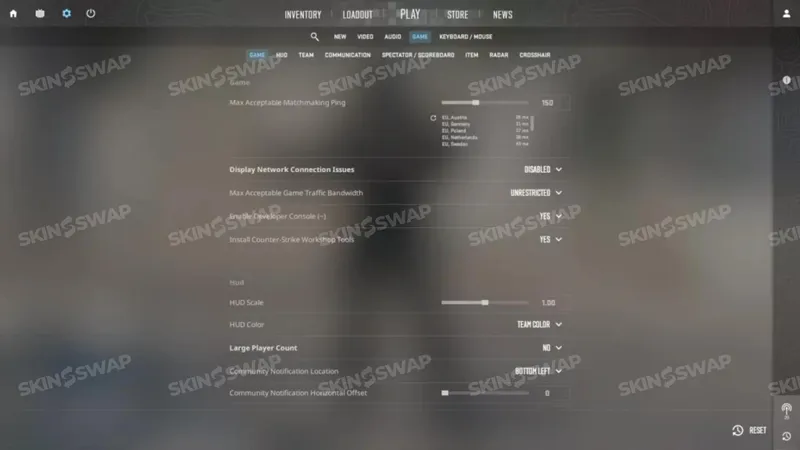
Step 2 - Open Game Settings and Find Telemetry
To access telemetry:
- Go to Settings.
- Select the Game tab.
- Scroll down to the Telemetry section.
This is where you’ll enable all performance metrics.
Step 3 - Turn On “Show Frame Time and FPS”
- Displays your frames per second and frame rendering time (in milliseconds).
- Frame time is often more useful than FPS for diagnosing stutter.
- Recommended setting: Always (so you can see changes even in menus).
Step 4 - Enable “Show Ping”
- Shows your ping to the server in ms.
- Great for spotting sudden latency spikes during gameplay.
- Recommended setting: Always.
Step 5 - Enable “Show Packet Loss/Misdelivery”
- Displays the percentage of lost or misdelivered packets.
- Even a small amount can seriously impact gameplay.
- Recommended setting: Always.
Step 6 - Adjusting Display Frequency (Always / Match Only)
- Always: Metrics show both in menus and during matches.
- Match Only: Shows only when you’re in a game.
For competitive players, “Always” is better for ongoing monitoring.
Where the Telemetry HUD Appears On Screen
- By default, in the top right corner of your screen.
- This position is fixed; CS2 does not currently allow moving it through settings. Players cannot move the display to the middle of the screen.
- The display is minimalistic, with small white text.
Method 2 - Using Console Commands in CS2
If you prefer more control over what’s displayed - or you just want to avoid digging into the settings menu - several console commands in CS2 can give you parts of the old net graph functionality. By using these commands, you can choose specific values to customize the position and size of the display for better visibility and performance monitoring.
cl_showfps (Levels 1-4) Explained
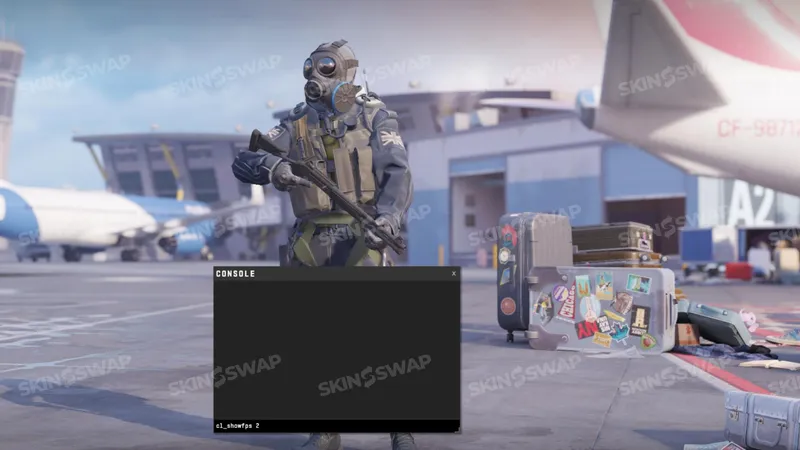
The cl_showfps command is the simplest way to display your frames per second. It offers multiple detail levels, each corresponding to different values you can set for the command:
- cl_showfps 1: Displays only your FPS in the top-left corner.
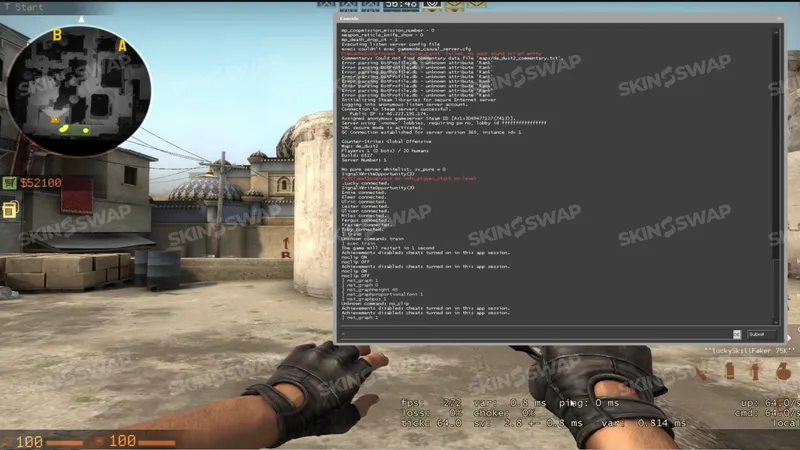
- cl_showfps 2: Adds more detail, including server tick rate and latency.
- cl_showfps 3 or 4: Shows additional information such as the current map and performance mode.
- cl_showfps 0: Turns the display off.
Competitive players often use level 1 for a clean, minimal counter or level 2 for quick network info without the full telemetry HUD.
cq_netgraph 1 - Network Graph Overlay (Match-Only)
This is the closest thing CS2 has to the old net graph command.
- Displays a small network activity graph in the top-right corner.
- Shows packet flow, with spikes indicating packet loss or choke.
- Only works during matches - it won’t display in menus or practice servers.
- Useful for identifying server-side lag during live games.
To turn it off, use: cq_netgraph 0.
cq_netgraph_problem_show_auto 1 - Ping & Packet Loss in HUD
If you just want quick network stability info without a full graph:
- Displays your ping and packet loss percentage in the HUD.
- Takes up very little space - ideal for players who want minimal screen clutter.
- Automatically hides when your connection is stable.
Disable with: cq_netgraph_problem_show_auto 0.
How to Turn These Commands Off
To stop displaying any of these overlays:
- Use the same command with 0 at the end (e.g., cl_showfps 0).
- Or simply restart the game, which resets temporary console changes.
Method 3 - Steam, NVIDIA, and AMD Overlays
If you’d rather not use CS2’s built-in telemetry or console commands, third-party overlays from your GPU software or Steam can display performance stats.
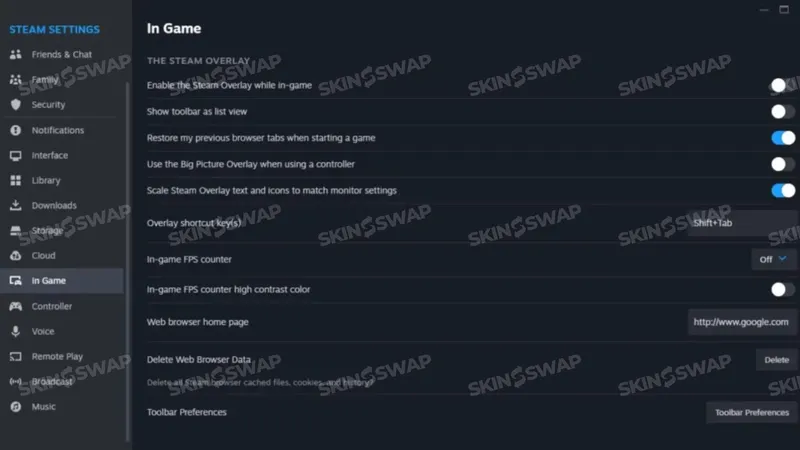
Enabling Steam’s In-Game FPS Counter
- Open Steam Settings.
- Go to In-Game.
- Enable the In-Game FPS Counter and select your preferred corner.
- Optional: Enable “High Contrast Color” for better visibility.
Pros:
- Works in any Steam game, not just CS2.
- Easy to enable and disable without launching the game.
Using NVIDIA GeForce Experience Performance Overlay
- Install or open GeForce Experience.
- Press Alt+Z to open the overlay.
- Click Performance and enable the display.
- You can show FPS, GPU/CPU usage, render latency, and temperature.
Pros:
- Gives more detail than Steam’s counter.
- Helps diagnose GPU-related performance drops.
Using AMD Radeon Performance Monitoring
- Open Radeon Software.
- Go to Performance → Overlay.
- Enable metrics like FPS, GPU load, temperature, and latency.
Pros:
- Lightweight overlay with minimal FPS impact.
- Built-in to AMD software - no extra installs.
Understanding Telemetry and Network Data
Displaying stats is only useful if you know what they mean. Here’s how to interpret them.
Frame Time vs FPS - What’s the Difference?
- FPS: Number of frames rendered per second.
- Frame time: Time (in milliseconds) it takes to render each frame. Example: 5ms frame time ≈ 200 FPS; 16ms ≈ 60 FPS.
- Stable frame time matters more than just high FPS - spikes cause stutter.
Interpreting Ping, Packet Loss, and Choke
- Ping:
- <50ms = excellent.
- 50–100ms = playable, but may feel less responsive.
- 100ms+ = noticeable delay in hit registration.
- Packet loss: Any value above 0% can cause gameplay issues.
- Choke: Packets delayed from client to server - usually a sign of server issues or connection instability.
Common Signs of Network Lag vs Low FPS Issues
- Low FPS: Game feels slow or “laggy” visually, but hit registration is on time.
- High ping: Shots feel delayed; enemies peek at you before you see them.
- Packet loss: Players teleport; movement feels inconsistent.
Troubleshooting Net Graph & Telemetry in CS2
If your metrics aren’t showing up or seem wrong, try these fixes.
Net Graph Not Showing - Common Causes
- Telemetry options set to “Never.”
- Trying to use cq_netgraph outside a live match.
- Outdated game client - update CS2.
Fixing Telemetry Settings That Reset
- Some updates reset game settings to default.
- Reapply settings after major patches.
- Save your config in autoexec.cfg to keep them persistent.
Why cq_netgraph May Not Work in Some Matches
- Not supported in certain custom servers or offline modes.
- Valve occasionally disables it in some game builds.
Optimizing Performance After Reading the Data
Once you know your stats, you can improve them.
Lowering Graphics Settings to Improve FPS
- Reduce resolution to increase frame rate.
- Lower or disable shadows, effects, and anti-aliasing.
- Disable V-Sync for reduced input lag.
Reducing Ping and Packet Loss
- Use a wired Ethernet connection instead of Wi-Fi.
- Close background downloads and streams.
- Connect to servers closer to your physical location.
When to Upgrade Hardware or Internet
- Consistently low FPS (<144) with low settings → consider GPU/CPU upgrade.
- High ping with good hardware → contact ISP or switch providers.
- Persistent packet loss → check router/modem health.
Final Thoughts on Monitoring Performance in CS2
The removal of the old net_graph in CS2 was a shock to many players, but the new Telemetry HUD and updated console commands give you all the essential information you need - often in a cleaner, more modern format. There are a lot of commands and features available for customizing your performance display, so you can tailor everything to your needs.
Whether you’re chasing perfect aim in Premier mode or just want to troubleshoot a stuttering match, knowing your FPS, ping, and packet loss helps you take control of your gaming experience. Combine Telemetry with console commands and overlays for a setup that fits your playstyle, and you’ll always know exactly what’s going on under the hood in CS2.
Stay up to date with the latest updates, guides, and news for Counter-Strike 2 to make sure you never miss important changes or new features. Don’t forget to bookmark this guide or check back regularly for new information. Be sure to follow our site or social channels for ongoing updates, tips, and more CS2 content.
FAQ - Net Graph in CS2
Can You Still Use net_graph 1 in CS2?
No. The command has been removed and is no longer recognized by the Source 2 engine.
How Do I Show Only My FPS?
Use cl_showfps 1 or Steam’s in-game FPS counter.
Can I Move the Net Graph to a Different Corner?
Not with built-in tools - position is fixed. Only third-party overlays allow this.
Is There a Way to Show Both FPS and Ping Without Telemetry?
Yes - combine cl_showfps with cq_netgraph_problem_show_auto 1.
Will These Settings Affect Competitive Matches?
No - these are client-side tools and don’t impact gameplay balance.